Welcome to
Macatawa
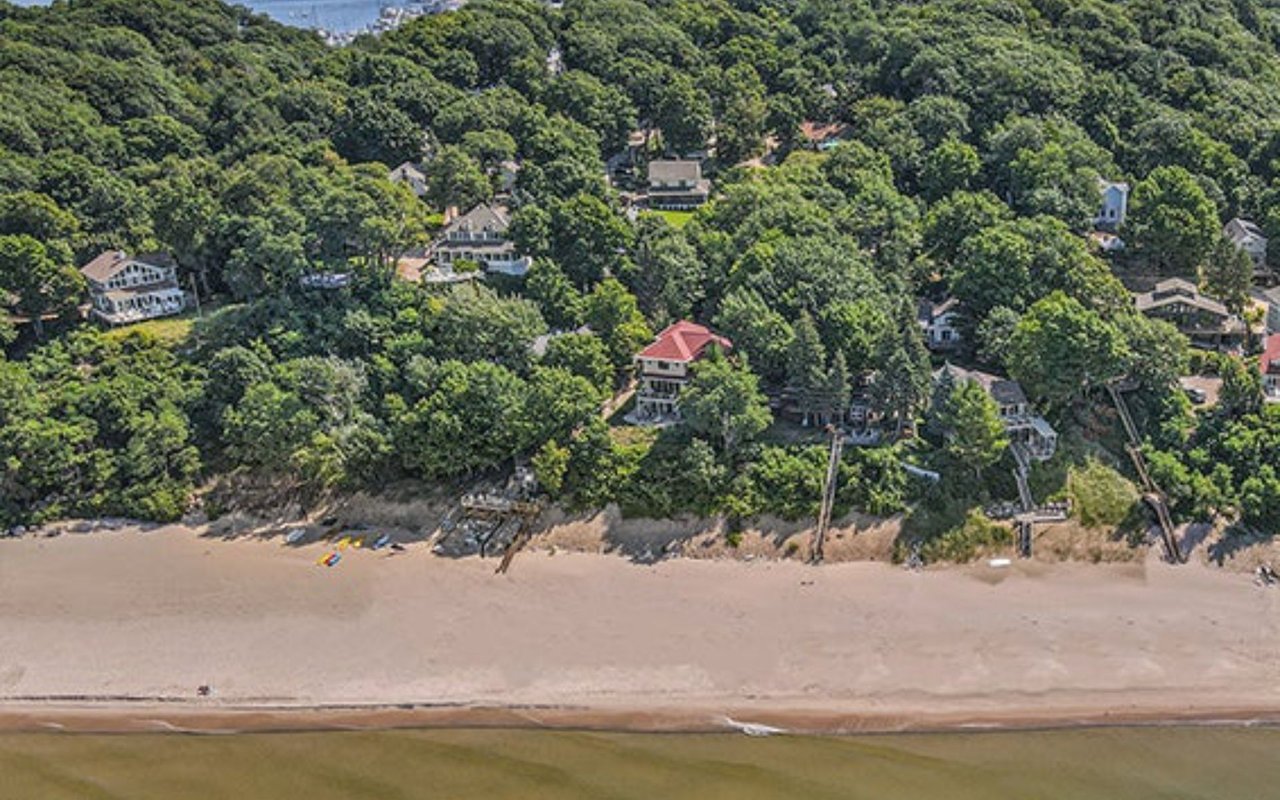
Experience the rich history and timeless charm of Macatawa Park, a historic Lake Michigan.
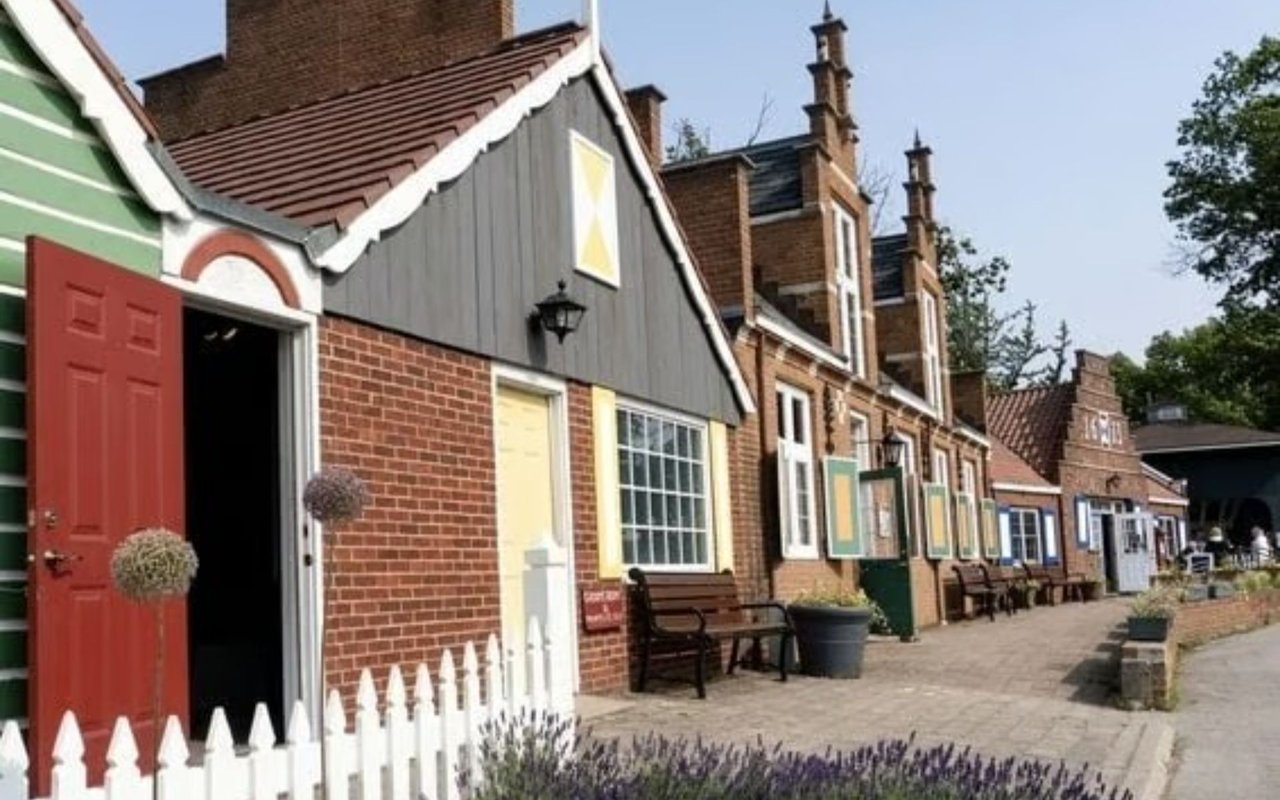
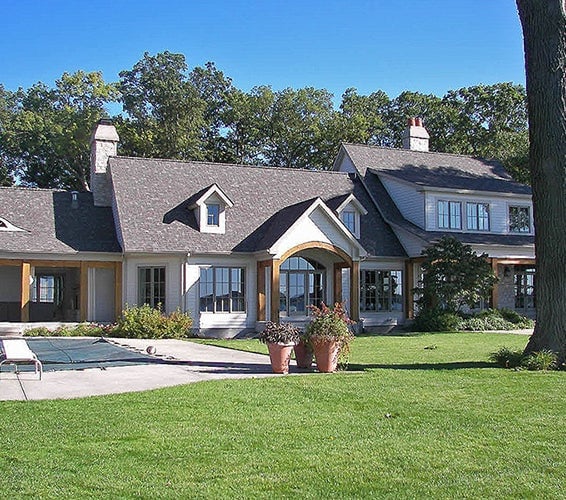
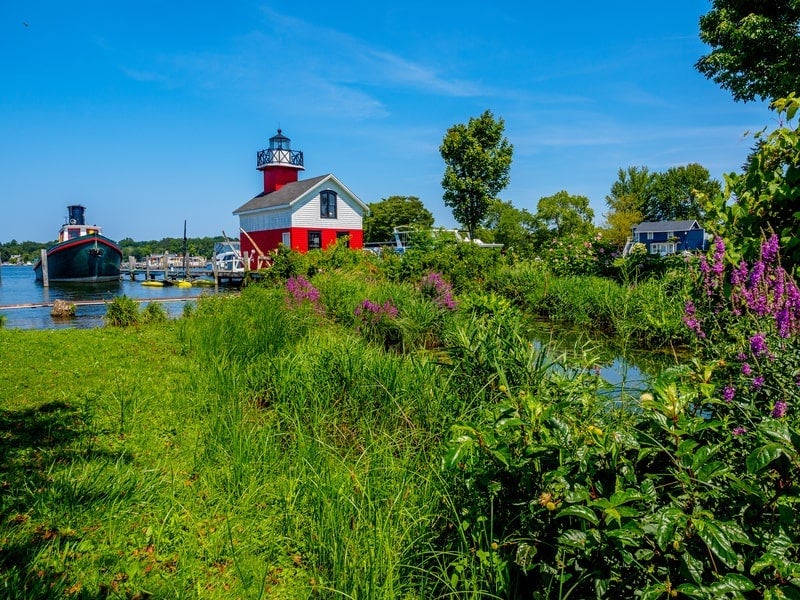
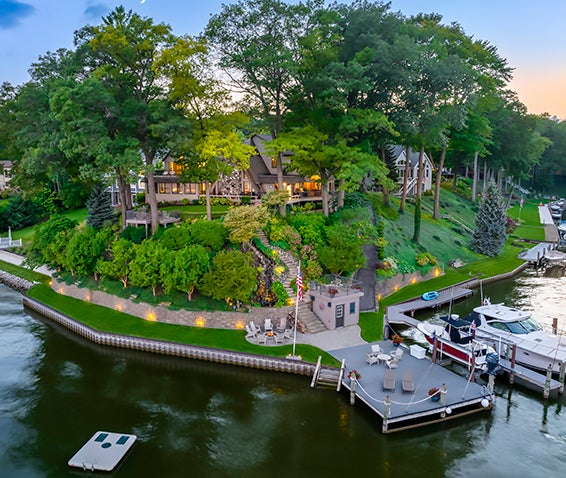
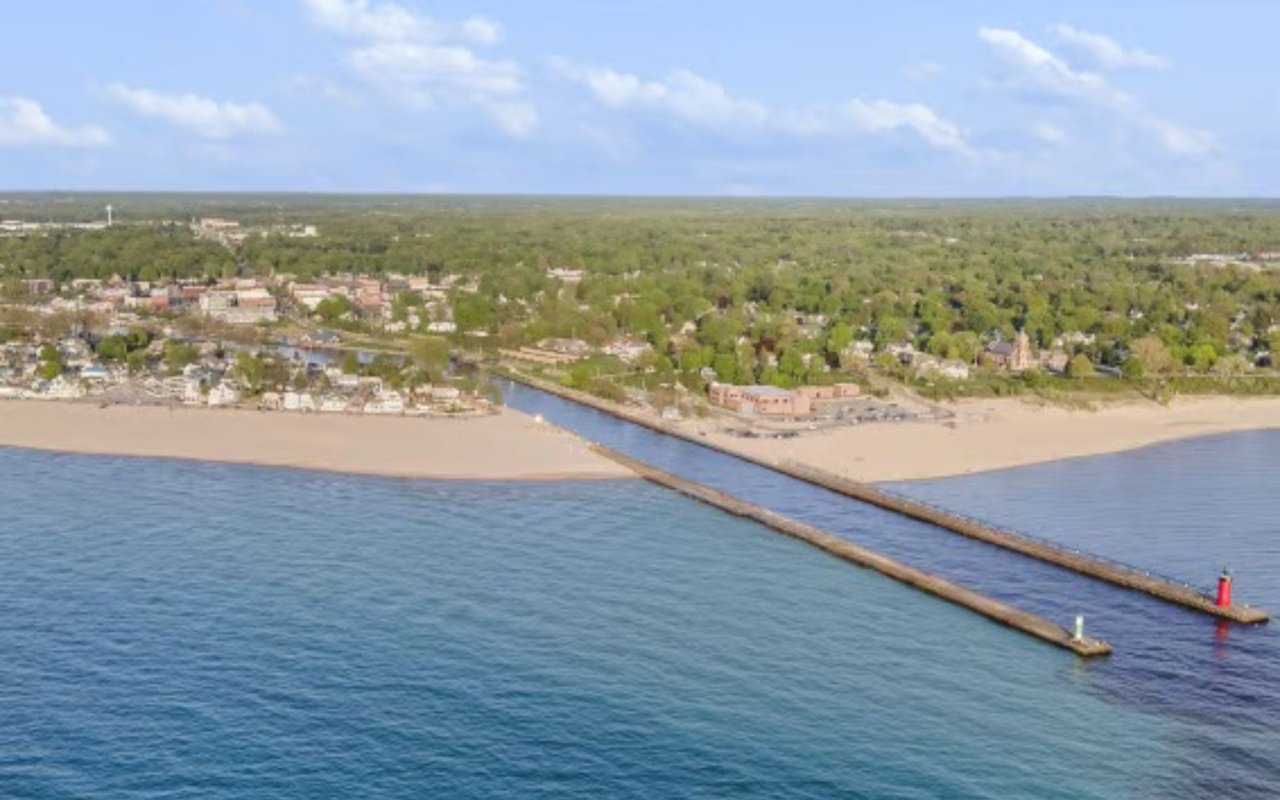
Experience the rich history and timeless charm of Macatawa Park, a historic Lake Michigan gated community renowned for its collection of historical cottages dating back to the 1800s. Macatawa Park itself emerged in 1881, when a group of visionaries acquired and platted land near the Holland harbor, establishing a public park and pleasure resort. Later that same year, the Macatawa Park Association was formed, setting the foundation for this beloved destination.
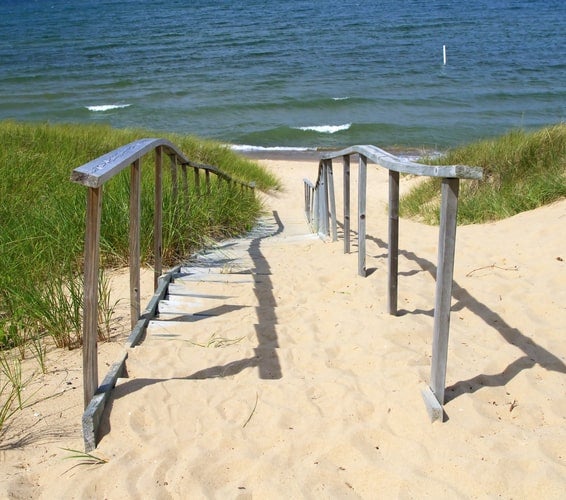
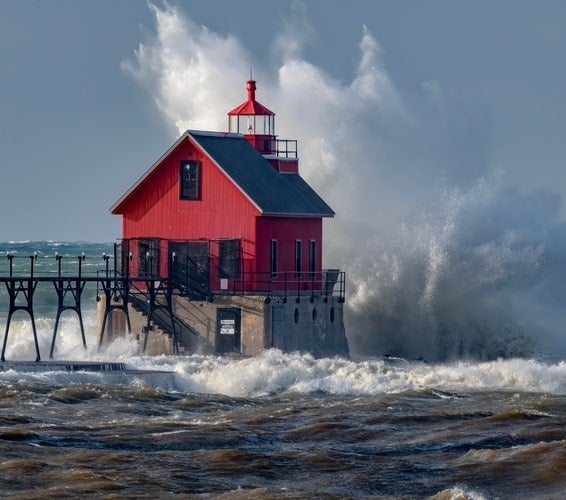
Today, Macatawa Park remains a captivating peninsula, adorned with rolling dunes and adorned by seasonal cottages and occasional year-round residents. The picturesque shores of Lake Michigan continue to offer a haven of tranquility and breathtaking beauty to those who appreciate its splendor.
65 people live in Macatawa, where the median age is 48 and the average individual income is $66,135. Data provided by the U.S. Census Bureau.
Total Population
Median Age
Population Density
Average individual Income
There's plenty to do around Macatawa, including shopping, dining, nightlife, parks, and more. Data provided by Walk Score and Yelp.
Explore popular things to do in the area, including Caribbean Sunrise, Tanglewood Winery, and Mac Adventures.
| Name | Category | Distance | Reviews |
Ratings by
Yelp
|
|---|---|---|---|---|
| Dining | 2.17 miles | 22 reviews | 5/5 stars | |
| Dining | 4.58 miles | 23 reviews | 4.9/5 stars | |
| Active | 0.9 miles | 8 reviews | 5/5 stars | |
| Active | 0.75 miles | 6 reviews | 5/5 stars | |
|
|
||||
|
|
||||
|
|
||||
|
|
||||
|
|
||||
|
|
Macatawa has 74 households, with an average household size of 2. Data provided by the U.S. Census Bureau. Here’s what the people living in Macatawa do for work — and how long it takes them to get there. Data provided by the U.S. Census Bureau. 65 people call Macatawa home. The population density is 44,576.213 and the largest age group is Data provided by the U.S. Census Bureau.
Total Population
Population Density Population Density This is the number of people per square mile in a neighborhood.
Median Age
Men vs Women
Population by Age Group
0-9 Years
10-17 Years
18-24 Years
25-64 Years
65-74 Years
75+ Years
Education Level
Total Households
Average Household Size
Average individual Income
Households with Children
With Children:
Without Children:
Blue vs White Collar Workers
Blue Collar:
White Collar: